Diagnostics
mattebox@0.13.0
This chapter covers stats, the trace, and replaying a trace.
Stats
engine.stats.throughput; // measured throughput, bits per second
engine.stats.snapshot();  // the full kernel state, read-only
engine.stats.trace();     // the entries kept, oldest first, none unless traceCapacity asks
The snapshot holds the presentation, the buffers, the scheduling state, the active tracks, the quality state, and the live window.
QoE metrics
The qoe stage measures the viewer’s experience and keeps it in the page.
Nothing is sent anywhere. It is in full; add it to another preset with
stages.
import qoe from 'mattebox/stages/qoe';

const engine = hls({ stages: [qoe()] });
engine.on('qoe:metrics', ({ reason, startupTime, rebuffers, rebufferDuration, switches }) => {
  analytics.record(reason, { startupTime, rebuffers, rebufferDuration, switches });
});| Field | Meaning |
|---|---|
startupTime |
Seconds from the load, or the first play request if later, to the first frame playing |
rebuffers |
Times playback waited for data after startup, seeks excluded |
rebufferDuration |
Seconds spent waiting, the current wait included |
switches |
Video quality changes after the first selection |
qoe:metrics fires with reason set to 'startup', 'rebuffer', or
'switch' each time a figure changes. engine.qoe reads the current
figures. A new load starts them over.
The trace
Every message the engine handles, and the effects it produced, is a trace
entry: a timestamp, the message, the effects, and a digest of the state
after it. A byte payload is recorded as its length, { $bytes: n }, never
the bytes. The engine keeps none of them. It hands each one to trace
listeners as it happens, so whoever wants a history keeps their own.
engine.on('trace', (entry) => {
  history.push(entry);
  if (history.length > 500) history.shift();
});
A page that wants the engine to keep the ring sets traceCapacity. Then
engine.stats.trace() answers with the entries, oldest first, and
engine.error carries them for the last fatal error. A stall on a viewer’s
TV comes with the exact sequence that led to it.
import { exportTrace, mattebox } from 'mattebox';

const engine = mattebox({ stages, config: { traceCapacity: 500 } });

engine.on('error', (error) => {
  if (!error.fatal) return;
  send({ error, trace: exportTrace(engine.stats.trace()) });
});
Replay
The reducer is pure, so a trace can be replayed offline. Feed the recorded messages into a fresh reducer and check that the same effects come out. If not, the result points at the first entry where the current code disagrees.
import { createReducer, initialState, replay } from 'mattebox';

const result = replay(entries, createReducer([]), initialState({}));
if (!result.ok) {
  console.log('diverged at', result.divergedAt, result.expected, result.actual);
}
Build the reducer with the same stage slices as the engine that recorded the trace. Slices see accepted commands only; a trace recorded before that rule, holding a command the kernel rejected, diverges on replay at that entry.
The playground
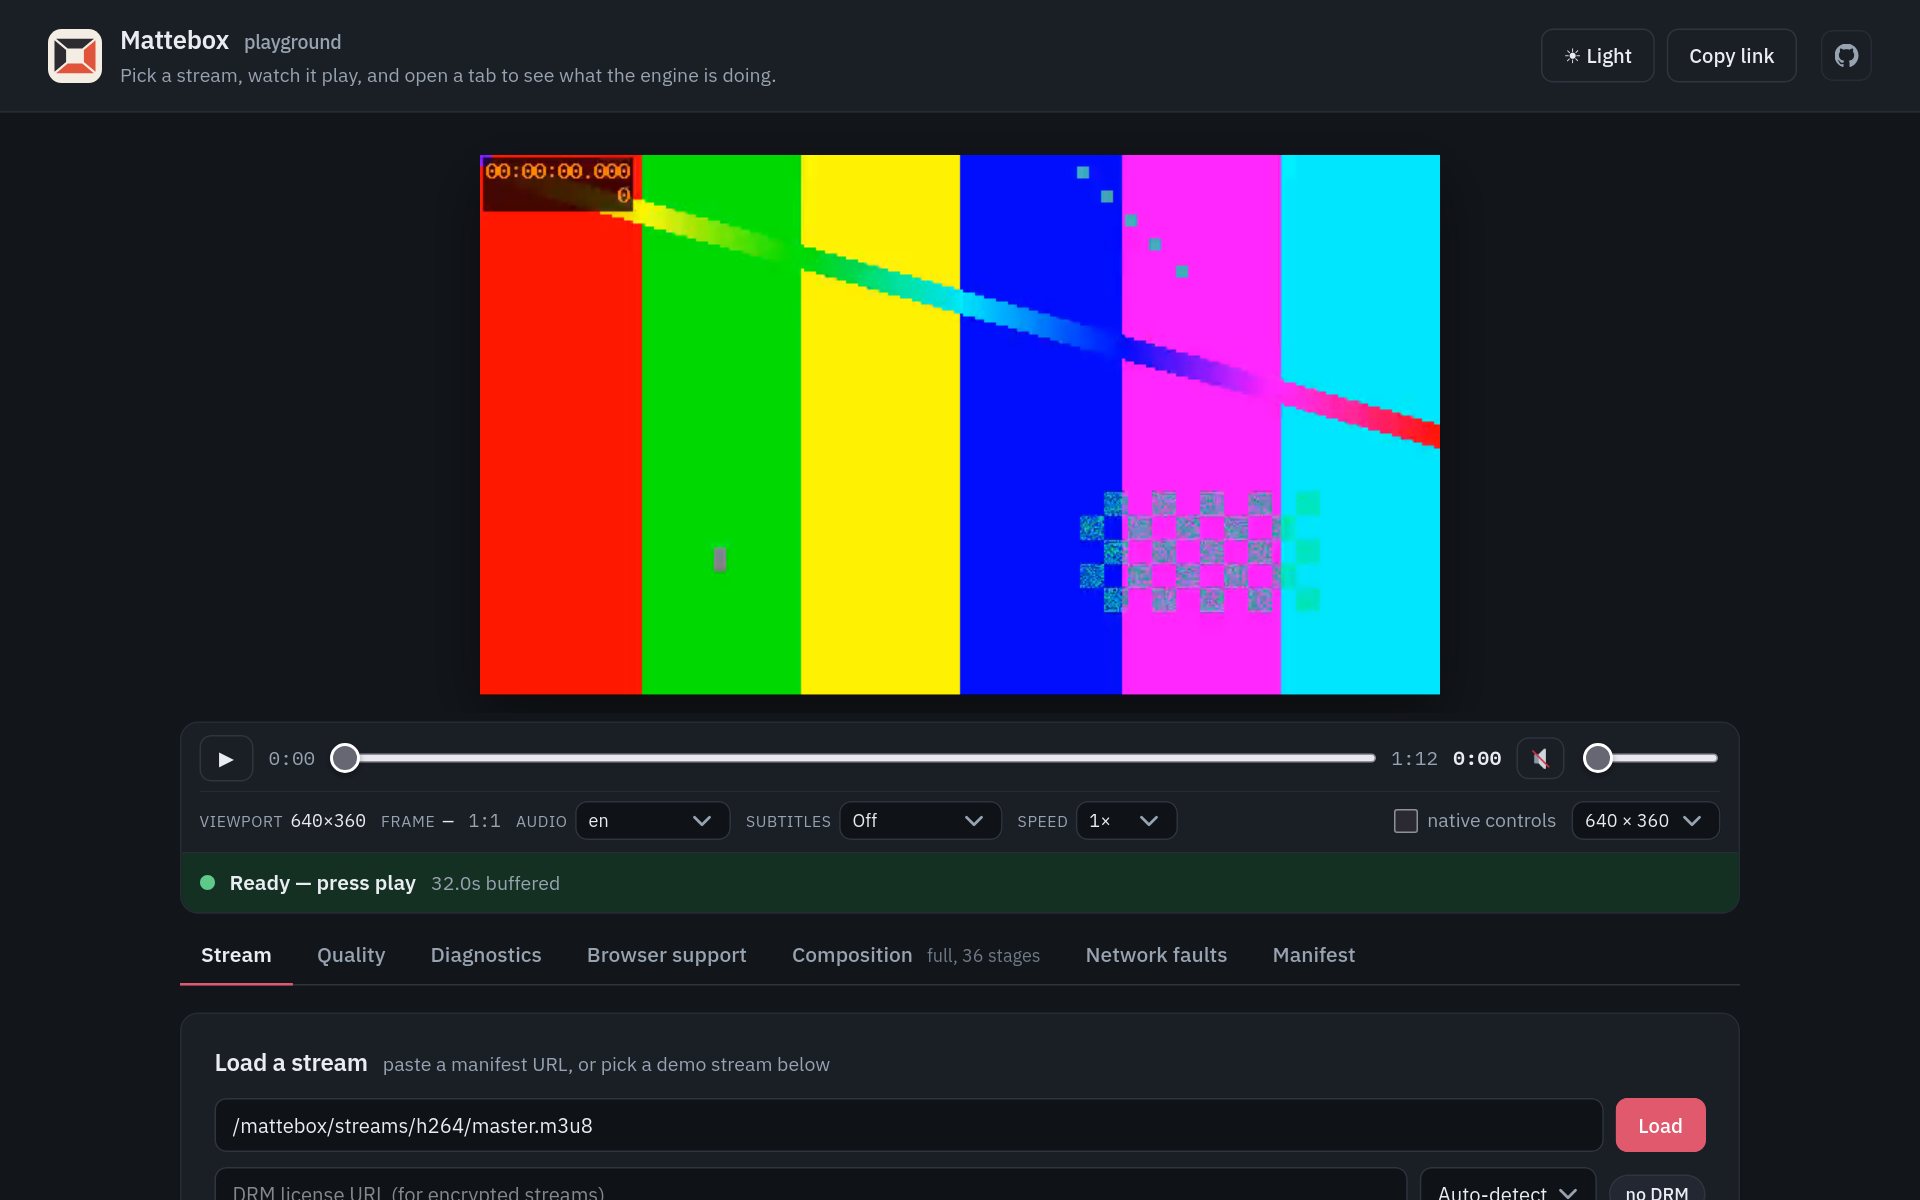
The hosted playground shows all of this live: the trace, the buffered ranges per rendition, the quality constraints, and a toggle per stage. Paste a manifest URL to try your own stream.
Example
Log recovery actions and throughput, and export the trace on demand.
import { exportTrace, mattebox } from 'mattebox';
import hlsCmaf from 'mattebox/protocols/hls-cmaf';
import abr from 'mattebox/stages/abr';
import recovery from 'mattebox/stages/recovery';

const engine = mattebox({ stages: [hlsCmaf(), abr(), recovery()], config: { traceCapacity: 2000 } });

for (const event of ['recovery:excluded', 'recovery:nudge', 'recovery:flush', 'recovery:skip']) {
  engine.on(event, (payload) => console.log(event, payload));
}

setInterval(() => {
  bandwidth.textContent = `${(engine.stats.throughput / 1_000_000).toFixed(1)} Mbit/s`;
}, 1000);

exportButton.onclick = () => {
  const blob = new Blob([exportTrace(engine.stats.trace())], { type: 'application/json' });
  window.open(URL.createObjectURL(blob));
};
Next: 13 Builds and targets.